Distance-time Graph
- What is a distance-time graph?
A distance-time graph simply
shows the relationship between time and position.
For example, given
the following data, plot the position-time graph? We can draw the
following graphs.
| Data |
|
time
(s)
|
position (s) |
| 0 |
0 |
| 1 |
20 |
| 2 |
50 |
| 3 |
130 |
| 4 |
150 |
| 5 |
200 |
|
 |
How do we evaluate the average velocity between
two points?
The tangent of a distance-time graph represents velocity since
 From the given curve, what
is the average velocity during the first 2 seconds?
From the given curve, what
is the average velocity of the whole trip?
From the given curve, what
is the average velocity during the first 2 seconds?
From the given curve, what
is the average velocity of the whole trip?
Velocity-time Graph
- What is velocity-time graph?
A velocity-time graph shows
the relationship between velocity and time.
- If a car moves at constant velocity of 5 m/s for
10 seconds. Plot a velocity-time graph.
| Data |
|
time
(s)
|
Velocity (s) |
| 0 |
20 |
| 1 |
21 |
| 2 |
24 |
| 3 |
27 |
| 4 |
28 |
| 5 |
30 |
|
 |
What are the types of data that we can obtain from a
velocity-time graph?
1- Instantaneous velocity at any time
1- Directly from velocity axis
at the edges of segments.
2- Within none linear segments approximate v to be
within v2 and v1.
3- Within linear segments use v=s(t-t1)+v1,
s=(v2-v1)/(t2-t1)
2- Acceleration at any time "t".
Acceleration=Segment
Slope
3- Average Acceleration at any time
interval (ti,tf)
a=Vf-Vi/(tf-ti)
4- Traveled Distance at any time interval (ti,tf)
Traveled Displacement=Area Under
the curve between ti and tf.
The area below the line represents the displacement
the object traveled since it can
be calculated by (time * velocity) which equals to
displacement.
5- Average-velocity at any time interval (ti,tf)
Average-velocity=Traveled
Distance/(tf-ti)
What is the significance of the area under the velocity-time curve
The area below the line
represents the displacement the object traveled since it can
be calculated by (time * velocity) which equals to
displacement.
What is the significance of tangent of a velocity-time graph?
the tangent of a velocity-time graph represents
instantaneous acceleration since
For example, the instantaneous acceleration when t = 3 at the below graph
is 3 m/s2, since the graph has a slope of 3 when t = 3.
What is the instantaneous
acceleration of the above object when t = 0?
What is the average
acceleration of the whole trip? (When t = 7, velocity = 26 m/s)
Does above object has a
constant acceleration?
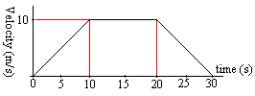
From
the velocity-time graph shown. Find
the followings
-
Acceleration
within the first 5 seconds
-
Acceleration
at t=15 seconds
-
Distance traveled within the first 20 seconds
-
Average
speed within the last 10 seconds
|
|
|